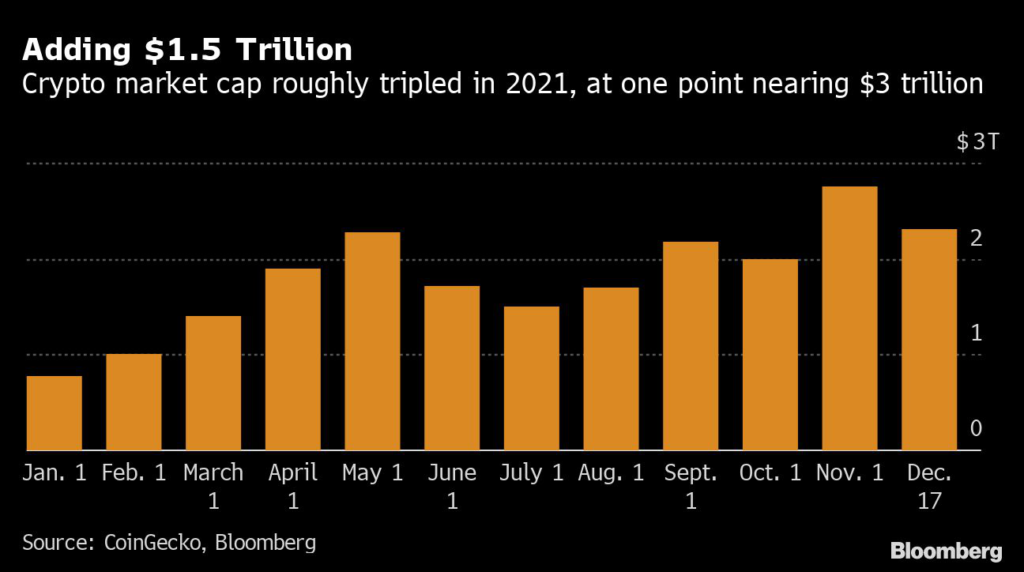
(Bloomberg) — Cryptocurrencies were peerless conduits of greed and fear in 2021, alternately minting and wiping out fortunes as they swung wildly while adding some $1.5 trillion in overall market value along the way.
Bitcoin, up more than 60% this year, absorbed much of the attention but had to share more of the limelight with the likes of Ether and Binance Coin as well as meme tokens such as Dogecoin and Shiba Inu.
In fact, Bitcoin’s share of the crypto market shrank dramatically over 2021 as other tokens rocketed, a sign of how investor interest in digital assets broadened out despite — or perhaps because of — enormous volatility.
The decline in Bitcoin’s dominance will likely continue next year “given the explosion of assets in the crypto space and the various use cases,” said Vijay Ayyar, head of Asia Pacific with crypto exchange Luno in Singapore.
Here are five key charts that tell the story of the year in crypto, and point to the path ahead:
The overall market value of cryptocurrencies climbed by about $1.5 trillion in 2021 to some $2.3 trillion as of Dec. 17, according to tracker CoinGecko, which counts almost 12,000 tokens.
Bitcoin, the world’s largest cryptocurrency, began the year with a 70% share of the market. That has fallen to less than 40%, in part as Ether’s popularity increased. But money has flowed into other tokens too, and for some that trend could be a sign of potentially destabilizing speculative froth.
Controversy over Bitcoin’s putative role in investment portfolios continues to rage. Proponents argue it offers a hedge against some of the highest inflation in a generation. But the token in 2021 tended to correlate more consistently with risk assets, like technology stocks, rather than inflation expectations.
The Bloomberg Galaxy Crypto Index’s more than 160% climb this year far outstrips the jump in more conventional assets like commodities and global stocks, up 23% and 13% respectively. Of course, given the huge swings in crypto, the old adage of no pain, no gain also applies.
Bitcoin is now testing key technical support levels after a more than 30% drop from a record high hit just over a month ago. One is the 55-week moving average — which in the past has sometimes provided a floor for selloffs — while another is a level of about $44,100 implied by a Fibonacci study of the rally from the March 2020 trough to the November 2021 peak. The cryptocurrency has already broken below a trendline drawn from the beginnings of its surge during the pandemic.
More stories like this are available on bloomberg.com
©2021 Bloomberg L.P.


