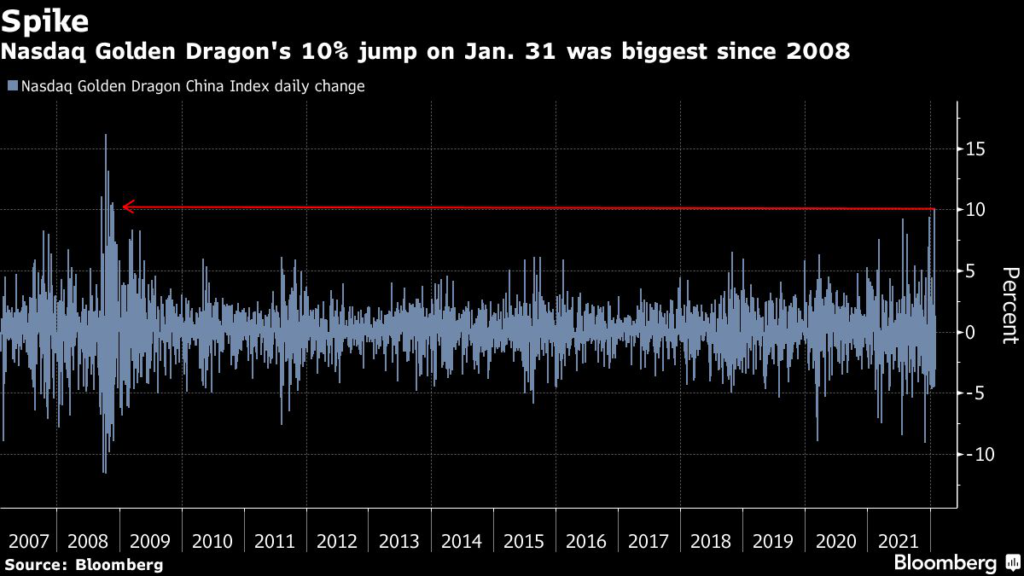
(Bloomberg) — Chart patterns for the Nasdaq Golden Dragon China Index are starting to suggest the equity gauge may extend a recent revival.
The 93-member measure of U.S.-listed Chinese shares is up over 5% this week — exceeding a near-2% climb in global equities — partly on bets that encouraging recent commentary from China’s cyberspace watchdog signals Beijing’s clampdown on the technology sector will ease.
Investors were likely drawn to U.S.-listed Chinese stocks due to “relatively cheap valuations compared with U.S.
tech companies, more accommodative monetary policy in China and what appears to be temporary easing in U.S.-China tensions,” said Jing Sima, China strategist at BCA Research Inc.
She wrote in an email she still favors Chinese onshore stocks because offshore shares continue to face regulatory headwinds, including delisting pressure.
Chinese equities suffered in the past 12 months, with the Nasdaq Golden Dragon China gauge slumping 57%.
Some Wall Street banks have now turned bullish for the reasons Sima outlined. But risks remain from an economic slowdown exacerbated by a property crunch and a capricious regulatory backdrop.
Here are two key charts for the Nasdaq Golden Dragon China gauge.
Clues From 2016, 2019
January’s price action traced a chart pattern known as a hammer candlestick on the index’s monthly chart.
Technical analysts view that pattern as a sign that a struggling asset may be due a recovery. In the past decade, there were two other such hammers — in 2016 and 2019 — which occurred before rallies of more than 100%.
Momentum Signal
Nasdaq Golden Dragon China’s 14-month relative strength index — or RSI — has dropped to a level where selloffs in the past petered out.
RSI is a momentum indicator that’s used to assess if assets have risen or fallen too far. The indicator is now in the same zone that accompanied previous troughs in the equities gauge, for instance in 2018.
More stories like this are available on bloomberg.com
©2022 Bloomberg L.P.