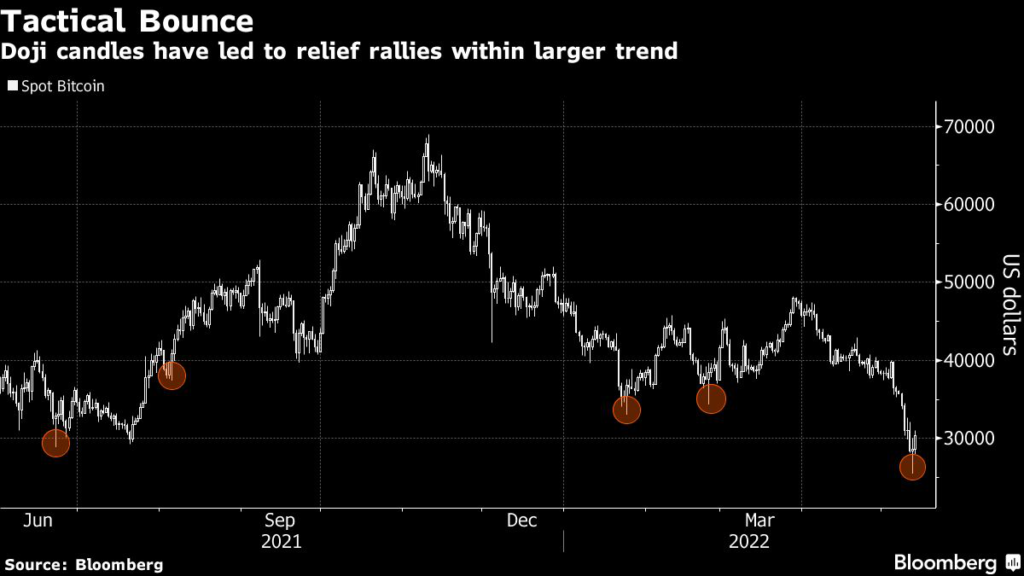
(Bloomberg) — Bitcoin’s latest plunge saw prices briefly break below $25,000, but an intraday recovery on Thursday saw the token close in the green. That rebound generated a so-called “doji” candlestick with a long lower tail, which technical analysts can read as a selling climax.
Over the last 12 months, the appearance of a doji during a period of declining prices has almost always been followed by a relief rally. If the bounce extends in the current case, resistance between $33,000-$34,500 could come into play.
More stories like this are available on bloomberg.com
©2022 Bloomberg L.P.


