(Bloomberg) — If a slew of technical charts are to be believed, Bitcoin may be poised for another downward move.
(Bloomberg) — If a slew of technical charts are to be believed, Bitcoin may be poised for another downward move.
The largest cryptocurrency by market value is down more than 50% this year and recently has been sitting in a range of about $19,000 to $25,000.
The token has struggled in recent months as the Federal Reserve raised rates and inflation remained stubborn. It was little changed at about $21,480 as of 9:03 a.m. New York time on Wednesday.
The nearby round-number level is a particular focus: $20,000 has been “sticky” over the last few months, said 22V technical strategist John Roque in a note Sunday — though he still sees it working down to $10,000.
Edward Moya, senior market analyst at Oanda, wrote in a note Monday that Bitcoin could be able to defend $20,000, “but it may be tough for that level to hold if King Dollar continues to appreciate leading up to Fed Chair Powell’s speech at the Jackson Hole Symposium.”
And it isn’t just that level.
Numerous technical analysts have been casting their eyes on even lower numbers after Bitcoin has several times attempted runs higher and then retreated.
“The sell-off is associated with a loss of short-term momentum, increasing risk within the long-term downtrend,” said Katie Stockton, co-founder of Fairlead Strategies, in a note Monday.
“Short-term oversold levels should produce a few days of stabilization, after which we expect a retest of and potential breakdown below long-term support in the ~$18,300 to $19,500 range.”
Here are four charts that bode ill for the original cryptocurrency:
Seasonality
September is the worst month of the year for Bitcoin.
Its price has fallen in the month in each of the last five years, by an average of about 10%.
Option Demand
Traders are paying a lot more for protection below $18,000. Implied volatility skew shows that traders are willing to pay elevated premiums for deep out-of-the-money puts — the jump is particularly steep closer to the $15,000 strike, which has the second-highest concentration of puts for the September expiry.
Option Quantity
The options chain for contracts expiring at the end of September shows that $20,000 is the strike price with the maximum open interest, so a sustained break below there may force put sellers to hedge their positions, pressuring prices further and bringing the June lows back into focus.
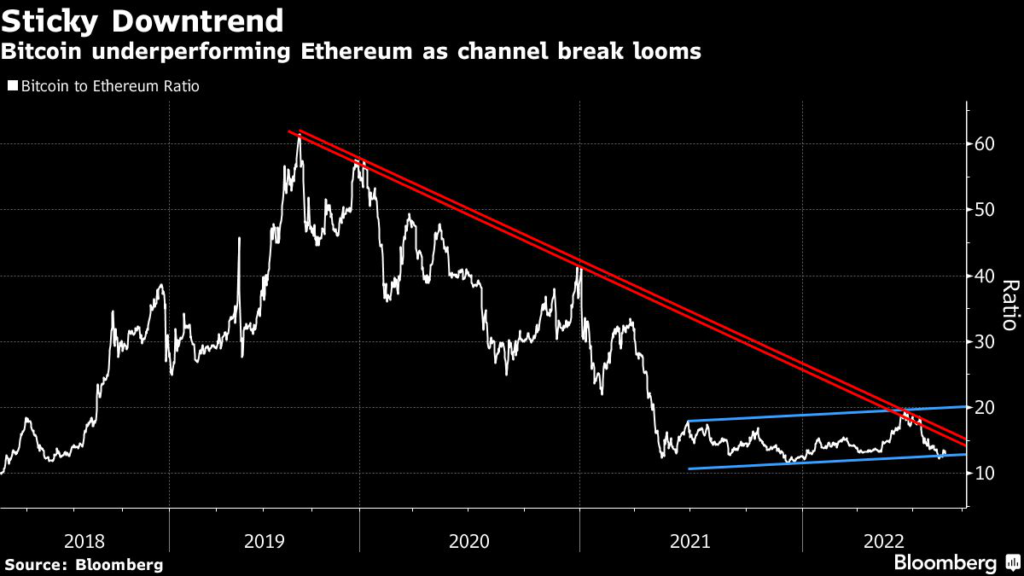
Underperforming
Bitcoin has recovered from its mid-June lows, but number-two crypto Ether has done even better amid enthusiasm about its coming Merge upgrade.
The recent selloff in both tokens has left their ratio testing the lower end of a rising channel whose downside resolution might see the it tumble to around six, from highs of around 60 in 2019.
More stories like this are available on bloomberg.com
©2022 Bloomberg L.P.