Technical trends suggest the Nasdaq Golden Dragon China Index could yet deliver more gains after pushing higher last month even as global shares slid the most since June.
(Bloomberg) — Technical trends suggest the Nasdaq Golden Dragon China Index could yet deliver more gains after pushing higher last month even as global shares slid the most since June.
The 72-member index of US-listed China shares added 6.1% in August, a period during which the Federal Reserve’s vow of restrictive monetary policy saddled financial markets with some of the worst cross-asset performance since 1981.
Bets on further stimulus to shore up China’s economy and progress on averting the delisting of Chinese firms from US exchanges over an auditing spat likely aided the jump.
Another contributor was an earnings-inspired, 45% rally in e-commerce company Pinduoduo Inc. — which accounts for 10% of the index.
While Covid curbs, a property crisis and power shortages pose major risks to China’s outlook, here are some key historical and technical trends that point to staying power for the Nasdaq Golden Dragon China index’s rally.
History Lesson
Nasdaq Golden Dragon China’s August advance came as the gauge tries to recover from a long slump.
A study of the past decade shows five other instances of a minimum 6% monthly jump coming off a bearish backdrop — the proxy used to represent the latter was a sub-50 relative-strength index, a measure of momentum.
On average, the China gauge rose 4%, 5.2% and 27.6% over three, six and 12 months respectively after those five instances.
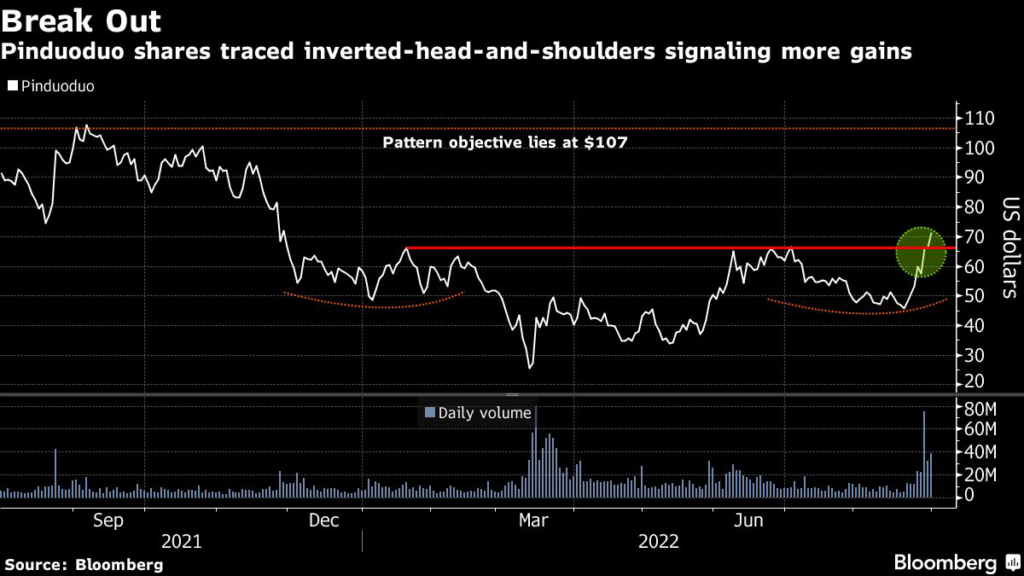
Pinduoduo
Pinduoduo’s shares have broken out of a so-called inverted-head-and-shoulders formation on high volumes.
This technical study suggests a target for the shares of $107. Ellie Jiang, a Hong Kong-based Macquarie Group analyst, has lifted her price target to $104 — implying 46% upside potential.
If these projections are near the mark, that would support the Nasdaq Golden Dragon China index given Pinduoduo’s weighting.
The online retailer rose for a fourth straight day in New York on Thursday, while the wider gauge slipped.
Support Level
Another technical study shows the index has held above a window around its 21-week moving average.
The fact it found support there apes a pattern evident in a bullish period for the gauge that peaked in 2021. Hence, some chart analysts might view the trend as an optimistic sign.
This week’s MLIV Pulse survey focuses on China.
It’s brief and anonymous, so please click here to share your views.
(Update with markets in the seventh paragraph.)
More stories like this are available on bloomberg.com
©2022 Bloomberg L.P.