Stock investors don’t need to look far this Halloween to give themselves a fright.
(Bloomberg) — Stock investors don’t need to look far this Halloween to give themselves a fright.
Plenty has been scary on Wall Street this year, from the crash in equities that’s sent some once-high-flying companies down 80% or more, to the spike in yields and the drubbing in cryptocurrencies.
Yet investors see many more potential hazards ahead. Here are some charts keeping Wall Street up at night:
Ghostly Curve
Doug Longo, co-head of product specialists at Dimensional:
“Last month’s US Treasury yield curve has taken on a ghostlike appearance. Since bond yields are one indicator of future returns, an investor’s position on the curve may determine whether this ghost is friendly like Casper or scary like Samara from The Ring.”
“For example, fear of future Fed rate hikes may have driven some to seek shelter in cash. But investors should remember that expected Fed activity is already priced in. The higher yields available from extending into the short end of the curve may be worth embracing, just like the friendly apparition.”
“On the other end of the spirit spectrum, core bond investors may have reason to fear indexed approaches to capturing the market. Lower yields around the 10-year segment of the curve suggest not all market segments have equally appealing returns, yet index bond funds may hold just as much in the dips as the bumps on the curve. That’s like getting candy corn instead of M&M’s in your trick-or-treat bag.”
Worker Dangers
Steve Chiavarone, portfolio manager and equity strategist at Federated Hermes:
“Prior to the pandemic, the equilibrium of the US labor market was defined, on average, by wage inflation of 3.3% with 4.7 million more unemployed workers than job openings. Currently, wage inflation is running as high as 6.7%, with 4 million more job openings than unemployed workers.”
“With wage inflation serving as the biggest driver of persistent inflation, this implies that in order to get inflation back down to the Fed’s target, we need to see an increase in the labor supply (less likely) or an increase in unemployment (more likely) of roughly 8.7 million jobs. Given a 159-million-person US labor force, this would imply a potential increase in unemployment of over 5% in order to re-establish labor market equilibrium.”
Spiking Mortgages
Liz Ann Sonders, chief investment strategist for Charles Schwab:
“The economy continues to suffer from a ‘rolling recession’ with different pockets hit at different times. Housing is undoubtedly one area in a recession, with housing affordability being hit from all sides, including the spike in mortgage rates, historically elevated home prices and negative real (inflation-adjusted) incomes.”
Rent Threats
George Pearkes, global macro strategist at Bespoke Investment Group:
“Hopes of a Fed pivot have to contend with high rental inflation. While leading indicators of rent inflation have crashed to negligible levels around 1% annualized, the construction of rent indices in CPI means that index is lagged.”
“At 40% of core CPI, rent inflation needs to decline dramatically to get monthly core prints close to 2% annualized.”
Foreboding Bear
Victoria Greene, founding partner and chief investment officer at G Squared Private Wealth:
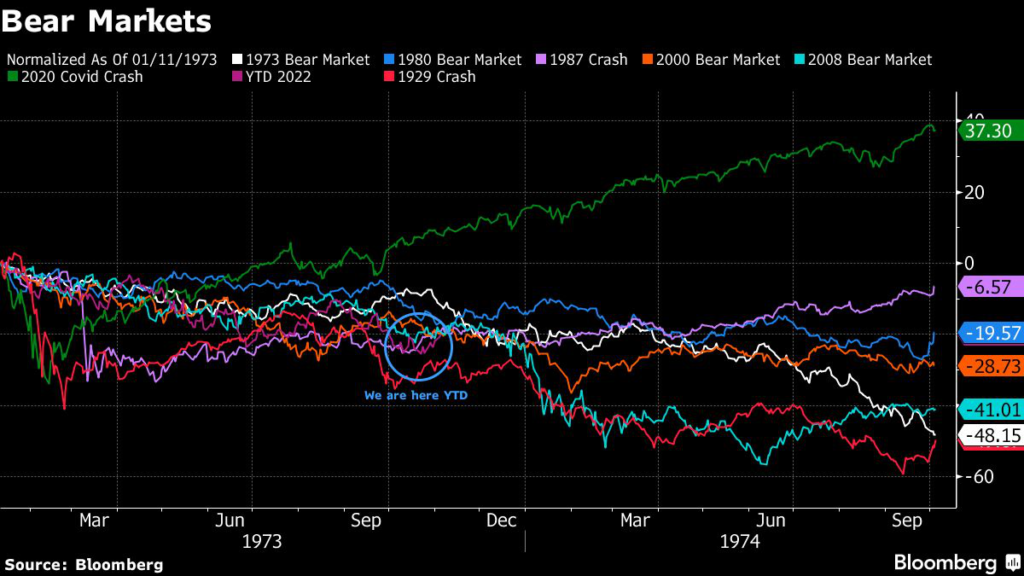
“Average bear markets tend to not be too long or too painful, but the current pattern aligns closer to the really bad crashes of 2009 and 1929 than I would like. During different economic periods, the Fed has shown a willingness to step in and provide a floor before it ever becomes that bad again.”
“What flavor of bear market will 2022 end up being? Consensus says moderate, normal, everyday bear market. This chart should spook investors that it might not be that way. Obviously 1929, 2020 and 1987 all had major 2x+ standard deviation selloff days. Might we see that in 2022 as well?”
Mauled Manufacturing
Matt Miskin, co-chief investment strategist at John Hancock Investment Management:
“One of the top leading economic indicators for the United States is the Institute of Supply Management (ISM) Manufacturing PMI New Orders index. It is a timely monthly business survey that asks manufacturing companies on the front lines of the economy whether new orders are picking up or slowing down.”
“When the index is in a downtrend and moving lower than the 47% level we are at today, there has often been a significant economic slowdown and likely recession.”
Liquidity Curse
Lauren Goodwin, economist and multi-asset portfolio strategist at New York Life Investments:
“Liquidity could be this cycle’s curse — or blessing. On aggregate, a sharp decline in central-bank liquidity creates risks for financial assets, and non-linear ones at that.”
“Central bankers don’t have as much experience in adjusting their balance sheets as they do with policy rates. However, as economic and market risks intensify, liquidity providers could present meaningful opportunity, both in bridging the economic gap for high-value assets, and by finding price opportunities in distressed ones.”
QT Winds
Steve Sosnick, chief strategist at Interactive Brokers:
“The Fed’s balance sheet has only declined roughly to start-of-year levels, and the monthly declines have been quite modest compared to the gains we saw in late 2020 through 2021 (not to mention the early 2020 explosion).”
“This visualizes just how much of a headwind QT might be for equities. It’s only just begun in earnest, and there is no reason to expect that even if the Fed slows or pauses rate hikes (let alone pivots) that they will take their foot off the QT brakes anytime soon.”
Missing Fear
Amy Wu Silverman, equity derivatives strategist at RBC Capital Markets:
“Despite recent earnings, rising inflation fears, geopolitical headwinds and tail risks, we are just not seeing fear and demand for hedges. This is why equity volatility has dramatically underperformed rates/FX volatility.”
“The SDEX Index gauges the market’s willingness to accept a one standard deviation loss by comparing the cost of ATM [at-the-money] options to the cost of OTM [out-of-the-money] puts struck one standard deviation OTM — in options speak, the ‘skew.’ Skew remains extremely low.”
“The TDEX Index gauges the market’s estimation of the likelihood of a three standard deviation drop in SPY over the next 30 days and the cost of insuring against such a drop. In options speak, the ‘convexity.’ TDEX is in its 15th percentile. Tails remain in its bottom quartile.”
Capex Collapse
Neil Dutta, head of economics at Renaissance Macro Research:
“The Fed has shot residential investment, but there is not much evidence of weakness outside housing. Could business investment be next?”
“Our tracker of capital spending intentions from the various regional PMIs points to slowing ahead. Over the last six months core durable goods shipments have been flat. Look for this to go negative.”
More stories like this are available on bloomberg.com
©2022 Bloomberg L.P.

