A failure by the US government to pay its debts on time would probably cause catastrophic fallout throughout global financial markets. But some are more directly in the firing line than others and observers are starting to zero in on when they will start to show clear signs of worry about the debt-ceiling impasse.
(Bloomberg) — A failure by the US government to pay its debts on time would probably cause catastrophic fallout throughout global financial markets.
But some are more directly in the firing line than others and observers are starting to zero in on when they will start to show clear signs of worry about the debt-ceiling impasse.
Right now, it’s difficult to get a clean read on the situation, in large part because investors don’t yet have a very specific timeframe to focus on.
As the potential crunch gets closer, however, investors will be able to narrow in on particular dates and that’s likely to show up in various indicators from Treasury bill pricing to auction outcomes, as well as the government’s own ledgers.
On top of that, the odds that an agreement isn’t reached are also likely to increase, providing scope for those distortions to be bigger.
The political fight over the nation’s statutory borrowing limit is underway in Washington and Treasury Secretary Janet Yellen has already begun using various accounting gimmicks to keep the US under its official limit.
It’s not clear though how long the government can keep things going under those so-called extraordinary measures — which are estimated to add some half a trillion dollars of headroom under the existing $31.4 trillion cap.
Most analyst estimates suggest some time in the third quarter of 2023, although there are some big variables in the mix right now, such as how the annual tax season goes.
Following are some charts to help gauge just how jittery markets are getting and what timeframes they’re most concerned about.
An Increased Risk Premium
If the US runs out of borrowing capacity, investors who hold debt that’s due to be repaid shortly afterward are among those who are immediately most exposed.
That’s because the government won’t be able to sell fresh securities to provide the necessary cash for repaying holders.
In previous debt-ceiling episodes — and there have been several over the past decade and a half — investors have demanded a premium in the form of higher yields for these particular securities to compensate for this additional risk.
The upshot is often an unusual kink in the bill curve around the most vulnerable point. All else being equal, longer-dated bills usually command a higher rate than shorter ones, although a market that’s pricing in the possibility of central-bank rate cuts as it is right now adds some complication to that idea, as does the relative lack of liquidity in bills beyond the six-month mark compared to some shorter-term instruments.
Even with those considerations in mind, however, it should become apparent if investors look to be avoiding particular issues because of ceiling concerns rather than any difference stemming from policy or liquidity.
At the moment, the curve shows various small dislocations around various points, but not one that currently shows major strain.
Lackluster Auctions
The unwillingness of investors to hold paper maturing around those riskier dates can also manifest itself in their behavior at regular government debt sales.
Even without a major shift in pricing, it’s possible to infer concern from which types of buyer are purchasing the more at-risk maturities. Before Yellen warned Congress about the debt cap and announced her plans for extraordinary measures, investors had shown early signs of avoiding six-month bills.
Until this week, the proportion bought by so-called indirect bidders — a group that includes money-market funds — had been relatively lackluster. That suggested, for a time, some waning of their appetite for paper due around July, although as the x-date becomes more clearly defined these investors may start shying away from other benchmark offerings instead.
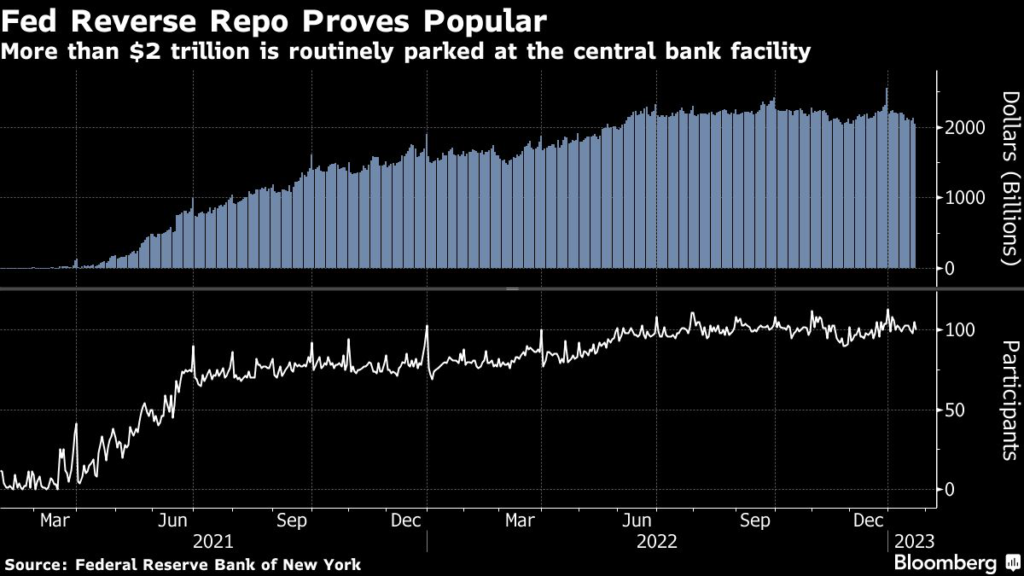
A Place of Greater Safety
Investors still need somewhere to park their short-term cash if they’re avoiding certain T-bills, and that could help add to already blockbuster demand to place money at the Federal Reserve’s facility for reverse repurchase agreements.
Investors have placed more than $2 trillion there every day for over half a year, fueled in large part by a shortage of bills across the spectrum relative to the amount of spare cash that needs a home.
Should investors start steering away from particular bill maturities, that could boost demand to place cash there. On top of that, the likely reduction in overall bill supply that goes hand-in-glove with the approach of the debt ceiling will also likely buoy usage, meaning this is likely to be a key metric for observers to keep an eye on.
Dwindling Government Cash
Finally, perhaps one of the most stark measures of how close America is to the edge — although not a market-based metric — is the Treasury’s cash balance, and the department’s predictions for where it will go.
The approach of the debt limit usually results in the Treasury drawing down the amount of ready cash it keeps as officials avoid borrowing excess money that the government doesn’t need right away. That’s less than ideal from the point of view of officials, because they like to keep a decent buffer and there are risks to not having leeway if there’s a disruption in debt markets.
The department provides regular data on how much cash it has, as well as forecasts as part of its quarterly financing announcements process.
The cash pile right now is around $471 billion, down from more than $600 billion at a similar time last year. Perhaps more notably, it’s already well below the levels that the Treasury had predicted for the end of December and March at its last quarterly announcements close to three months ago.
That suggests a faster outflow than they had banked on and analysts will be keenly attuned to what predictions they give at their upcoming announcements next week.
More stories like this are available on bloomberg.com
©2023 Bloomberg L.P.