(Bloomberg Markets) — When the first issue of Bloomberg Markets appeared in July 1992, little did we know that we were entering three halcyon decades of the easiest credit since the 1950s and, most recently, the strongest growth in modern times.
The catalyst was the diminishing cost of capital, abetted by disinflation as China and the Pacific Rim became globalization’s primary source of cheap labor.
Having raised borrowing costs to conquer inflation in the early ’80s, the Federal Reserve and other major central banks found themselves taking unprecedented measures to restore growth after the 2008 financial crisis and the onset of the coronavirus pandemic.
Soaring demand for debt, equity, and money in all its forms created a 24-hour Wall Street bazaar of wealth such as the world had never seen.
Today, some Wall Street strategists and investors see an end to this golden era.
Trade disputes and war are straining the global supply chains that helped keep prices low. The Fed is committed to raising interest rates to bring down the highest inflation since 1983. Recession fears are growing.
Prices of stocks and bonds are tumbling.
And yet, what if the past three extraordinary decades in markets have provided businesses with just the resources they need to be resilient through a period of higher rates and help the economy rebound?
CENTRAL BANKS’ aggressive response to the 2008 credit crisis and the pandemic in 2020—reducing overnight rates to little more than zero and purchasing vast quantities of bonds—caused inflation-adjusted interest rates to vanish.
That helped drive demand for financial assets. The value of debt sold by developed- and emerging-market issuers increased 11‑fold during the past three decades, to $63 trillion from $5.9 trillion, according to the Bloomberg Global-Aggregate Total Return Index.
In the two years since 2019, companies raised a record $6.5 trillion worldwide, more than four times what was borrowed in the same period two decades ago.
The cost of borrowing for US companies is about 14% below the 30-year average; Coca-Cola Co.
paid only 2.25% in 2021, or about a third of its rate in 1992. The average cost for emerging-market borrowers plummeted to 2.5% in 2020 from 18% in 1995, or 25% below the average over three decades.
Corporate America was never so healthy, thanks to the least burdensome debt ratios in modern times.
Even with record borrowing in recent years, the total debt-to-asset ratio of the companies in the S&P 500 declined to 23.7% as of mid-May, about the lowest in three decades and substantially below the 31.2% average since 1990, according to data compiled by Bloomberg.
At the same time, total earnings per share of the S&P 500 jumped to a record-high $203.
Innovation was the biggest prize of descending interest rates. All but one of the world’s 10 biggest companies by market value are based in the US, and four of these publicly traded giants—Alphabet, Amazon, Meta Platforms, and Tesla—didn’t exist when this magazine was born.
Total publicly traded equity raised in 2021, including $684 billion of initial public offerings, climbed to a record $1.42 trillion, 18 times the amount sold in 1992.
The New York Stock Exchange’s value tripled, to $31.8 trillion from $10.6 trillion in 2002, and London’s $3.25 trillion FTSE All-Share Index is one and a half times its 2000 valuation. In Hong Kong as much as $22 billion changed hands daily last year on the stock exchange, 65 times the volume in 1992.
The MSCI World Index increased sevenfold, to $54.2 trillion, since 1995.
Technology, the fastest-growing industry, expanded by 26 times, led by Apple Inc. and Microsoft Corp. Health-care companies, including UnitedHealth Group Inc. and Johnson & Johnson, followed with 14 times growth.
The value of communication services like Alphabet Inc.’s Google and Meta Platforms Inc.’s Facebook increased 10 times.
The auto industry provides some of the strongest evidence of the economy’s transformation.
Toyota was No. 1 in 1992, followed by General Motors, Ford, and Daimler-Benz. Three decades later, Tesla Inc., which joined the top 10 in 2017, is the leader. By early 2022 the company’s market cap had ratcheted up its $1.8 billion IPO value by almost 1,000 times, to $1.1 trillion.
Tesla debt, initially rated noninvestment-grade at B- by Standard & Poor’s in 2014, was subsequently upgraded four times to the cusp of investment-grade.
Its credit-default swaps outperformed the strongest automakers, including BMW, Honda, Mercedes, and Toyota, in 2022.
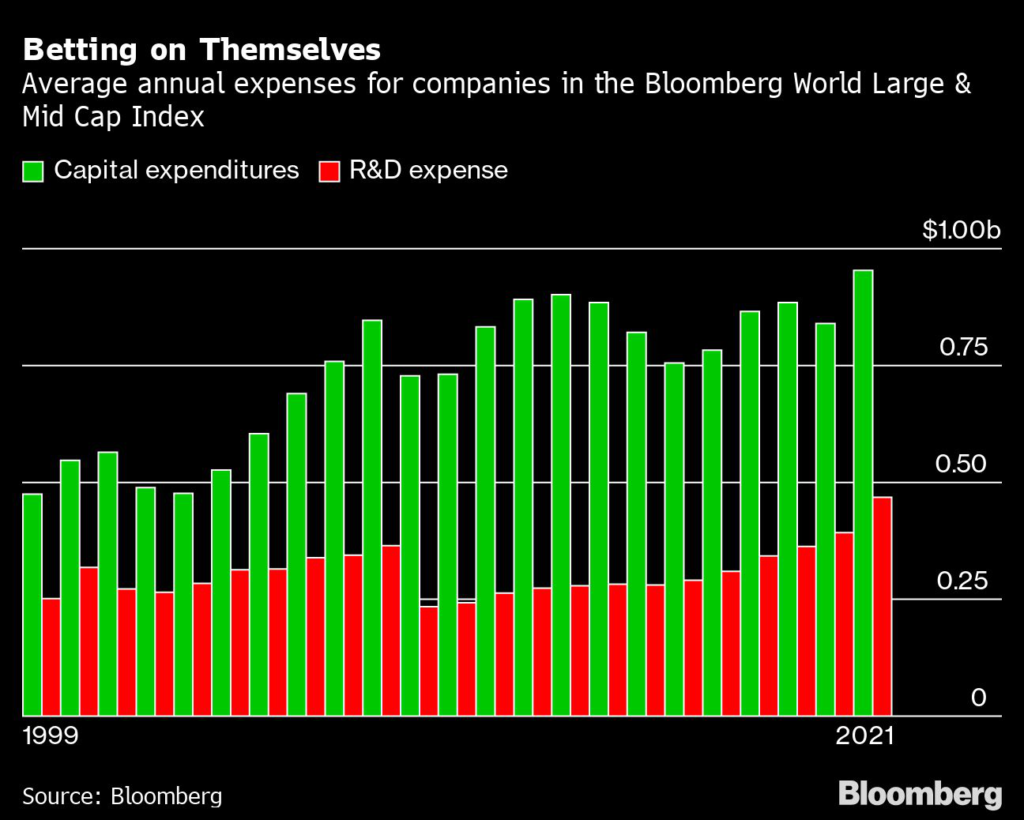
AS MONEY became cheaper, the 3,000 companies in the Bloomberg World Large & Mid Cap Index in 2021 spent on average:
$954 million on capital expenditure, twice what they spent two decades ago ($476 million in 1999).
$414 million to buy back their shares, or 3.5 times what they spent in 1999 ($116 million).
$694 million to pay cash dividends to shareholders, or 4.7 times what they paid two decades ago ($148 million).
$468 million on research and development, or twice the amount spent in 1999.
AMONG THE LEADING companies, R&D expenditure had really soared by 2021:
Apple spent $22 billion, or 49 times its expense 20 years ago.
Microsoft spent $21 billion, or five times its expense in 2001.
Tesla spent $2.6 billion, or 41 times its expense in 2007, when data became available.
Alphabet and Amazon.com Inc.
spent more than 1,000 times what their R&D expense had been when they initially traded as public companies.
None were among the 10 largest companies in 1992.
CORPORATE AMERICA wasn’t the only beneficiary of declining capital costs.
The historical dichotomy between developed and emerging markets also diminished during the past three decades. By 2021, equity as measured by the MSCI World Index increased 15 times, to $21.4 trillion, in emerging markets, growing faster than in developed markets, where it grew by 11 times, to $64 trillion.
Not surprisingly, financial assets as a percentage of global gross domestic product hover near all-time highs, with average bank assets as a percentage of GDP in 142 countries totaling 73.3% as of 2020, the latest available data, dwarfing the 43.9% in 1992.
The ratio was 49.1% in 2002 and 66.1% in 2012, according to Bloomberg data.
So, will the low cost of capital become a distant memory? Is the halcyon era finished?
The answer likely resides with the people who live in the bond market.
That would include Dan Ivascyn, who manages the $128 billion Pimco Income Fund, the largest fund tracking the Bloomberg US Aggregate Bond Index, for Newport Beach, Calif.-based Pacific Investment Management Co.
Ivascyn, who’s also Pimco’s group chief investment officer, says that though there’s much uncertainty about inflation, markets and consumers aren’t assuming it will continue the way it did in the ’70s.
“Your expectations are still that inflation will decline, and that’s supported by themes in the market now for at least a couple of decades,” he says.
Additionally, after a sustained period of very low interest rates and strong equity and credit market performance, households and companies have been able to borrow and raise money more than ever before, Ivascyn says.
“So there’s an inherent cushion in the economy now that could create much more resiliency in the face of rising rates,” he says.
As the last 30 years have proven, markets can defy the skeptics.
—With Shin Pei, Jennifer Liu, Samarth Dua, and Sumit Sinha
Winkler is editor-in-chief emeritus of Bloomberg News. This column doesn’t necessarily reflect the opinion of Bloomberg LP and its owners.
More stories like this are available on bloomberg.com
©2022 Bloomberg L.P.